

The Finance Decoder: What 17 Years of San Diego's Financial Reports Actually Show
Every year, the City of San Diego publishes an Annual Comprehensive Financial Report. The ACFR is the most comprehensive analysis of the city's actual spending, uses standardized accounting methods that make it comparable across cities, and is independently audited. It is also several hundred pages long, written in accounting language, and structured to show only two years of data at a time: the current fiscal year and the one immediately before it. A city can be quietly losing financial altitude for fifteen years and its ACFR will never say so directly. Each annual report looks, in isolation, like a reasonable snapshot.
An airline pilot doesn't wait until the plane drops from 35,000 feet to 10,000 feet to take action. The altitude number matters, but the rate of descent is what tells you whether you have time for calm corrective steps or whether you're bracing passengers for a hard landing. Between 35,000 and 10,000 feet there's room for measured, strategic intervention. Below 10,000 feet you're in crisis mode. Publicly traded corporations have real-time stock prices and financial dashboards that give investors and executives a continuous picture of trajectory. Cities don't have anything equivalent. Nobody is tracking municipal fiscal health over the long term, in a visual form that makes the rate of descent legible at a glance. The ACFR, for all its detail, doesn't do this.
That structure isn't an accident. It reflects how government financial reporting has evolved: to satisfy auditors, bond raters, and regulators who care primarily about short-term balance. Cities are effectively required to report as if they were publicly traded corporations optimizing for near-term metrics. But cities are not corporations. They are permanent institutions. A corporation that fails can be liquidated; a city that fails still has residents who need streets repaired, fire stations staffed, and pipes maintained. The obligations don't disappear because the finances collapsed. Cities are, in a meaningful sense, the functionally permanent embodiment of a community's commitment to its own future.
Strong Towns San Diego read 17 consecutive years of those annual reports and built the charts below using the Strong Towns Finance Decoder, a framework based on the Indicators of Financial Condition methodology developed by the Public Sector Accounting Board (PSAB) in Canada and adapted for American ACFRs by the national Strong Towns organization. Unlike the ACFR and unlike this year's budget, the Finance Decoder is designed to show what is happening over time. Here is what it shows for San Diego.
What the Finance Decoder is, and what it isn't
This is not an analysis of this year's budget, unlike the ACFR and unlike the city's annual budget process. The Finance Decoder does not evaluate whether the city met its revenue projections, or whether departments came in under appropriation. If your interest is in the annual budget cycle, there are other tools for that.
The Finance Decoder asks a different and harder question: over the arc of years, is this city becoming more or less financially resilient? Annual budgets measure short-term balance. They confirm that revenues exceeded expenditures in a twelve-month window, which is a necessary discipline, but one that systematically understates what governments actually are. A city can balance its budget this year while quietly accumulating obligations that will land on residents who aren't yet voters. Strong Towns has documented this pattern across cities throughout North America, and the finding is consistent: not a single city analyzed so far has had majority positive indicators across the Finance Decoder's seven metrics. This is not a San Diego problem. It is a structural problem across North American municipalities. San Diego's opportunity is to be among the first major cities to name it clearly and respond to it deliberately.
Electoral cycles compound the problem, though not through bad intent. Most San Diego officials are genuinely trying to do right by their communities; notably many have explicitly expressed no interest in higher office, which suggests that at least some of the pressure toward short-term thinking is structural rather than personal. The deeper challenge is that even well-intentioned leaders, when making decisions outside their primary areas of expertise, rely on heuristics. And the heuristics built into standard government reporting are calibrated for the short term. The result is that good decisions in one area can quietly undermine what a better-informed colleague is trying to accomplish in another. No foul play required. The Finance Decoder is an attempt to provide the tools that make long-term consequences legible before they become emergencies.
The framework can be used to argue for or against specific policies: more spending, less spending, different revenue structures, different investment priorities. The numbers don't have a political preference. This is not an argument for small government or large government. It is an argument that anyone who wants the city to be capable of funding its ambitions, whatever those are, needs to understand whether it is building or eroding the fiscal foundation those ambitions require. The numbers just need to add up.
With that framing in place: here is what San Diego's own data shows.
The charts, one by one
Two contextual notes before the analysis. First, the 2013-2014 improvement visible in many charts traces to California's dissolution of Redevelopment Agencies, which transferred a one-time stock of assets to cities. Second, the steep drops visible in 2015 and 2018 reflect federal accounting rule changes (GASB 68 and GASB 75) that required cities to recognize pension and retiree healthcare obligations on their balance sheets for the first time. Those obligations existed before; the reports just couldn't show them. The interactive charts above let you exclude those one-time events from the trend line to see the underlying structural trajectory.
A note on the historical window: this analysis starts in FY2009. The City of San Diego publishes ACFRs going back to 2002 on its website, but major changes to reporting requirements around that period make pre- and post-2009 comparisons difficult to do cleanly. Had we gone back further, we would see the 2007-2008 financial crisis and the Federal Reserve's emergency lending programs reflected in the data, as well as the injection of pandemic stimulus cash into city budgets during those years. We plan to extend the analysis back as far as the reporting formats allow, with the goal of capturing the full infrastructure lifecycle, which in many cases runs 30 to 50 years. The present analysis represents what is currently practical given the published data.
Net Financial Position: San Diego has never broken even. Not once in 17 years.
A quick definition before the data. Liquid assets are what the city can access quickly without selling anything: cash in the bank, plus money owed to the city that is expected to arrive soon (receivables). Liabilities are everything the city owes: bond debt payments, pension commitments, amounts owed to employees, contractors, and other creditors. The Net Financial Position is the gap between the two.
-$5.6B in FY2025. Largest single-year drop on record.
The Finance Decoder's contribution here is not the metric itself, which appears in standard accounting; it is plotting that metric over time. Think of it as the altitude gauge that tells the financial department and state regulators whether the city is ascending or descending, and at what rate. For the general public, it answers the most direct version of the question: is the city's financial position getting better or worse over time?
Every year in the dataset, San Diego's liabilities have exceeded its liquid assets. The gap has grown from -$1.4 billion in 2009 to -$5.6 billion in 2025. The 2013-2014 upturn was the redevelopment agency windfall. When that wore off, the underlying trend resumed, and FY2025 recorded the largest single-year drop in the entire dataset.
Financial Assets to Total Liabilities: Is the city living paycheck to paycheck?
This metric is known in business finance as the Quick Ratio. As a snapshot, it answers whether an organization can pay off its immediate obligations with the cash and near-cash it holds. Plotted over time, it becomes something more useful: a picture of the rate of descent. How long has the city been below the waterline, and is the trajectory improving or worsening? It is the financial equivalent of the pilot asking not just what altitude we're at, but how long we've been losing altitude and how fast.
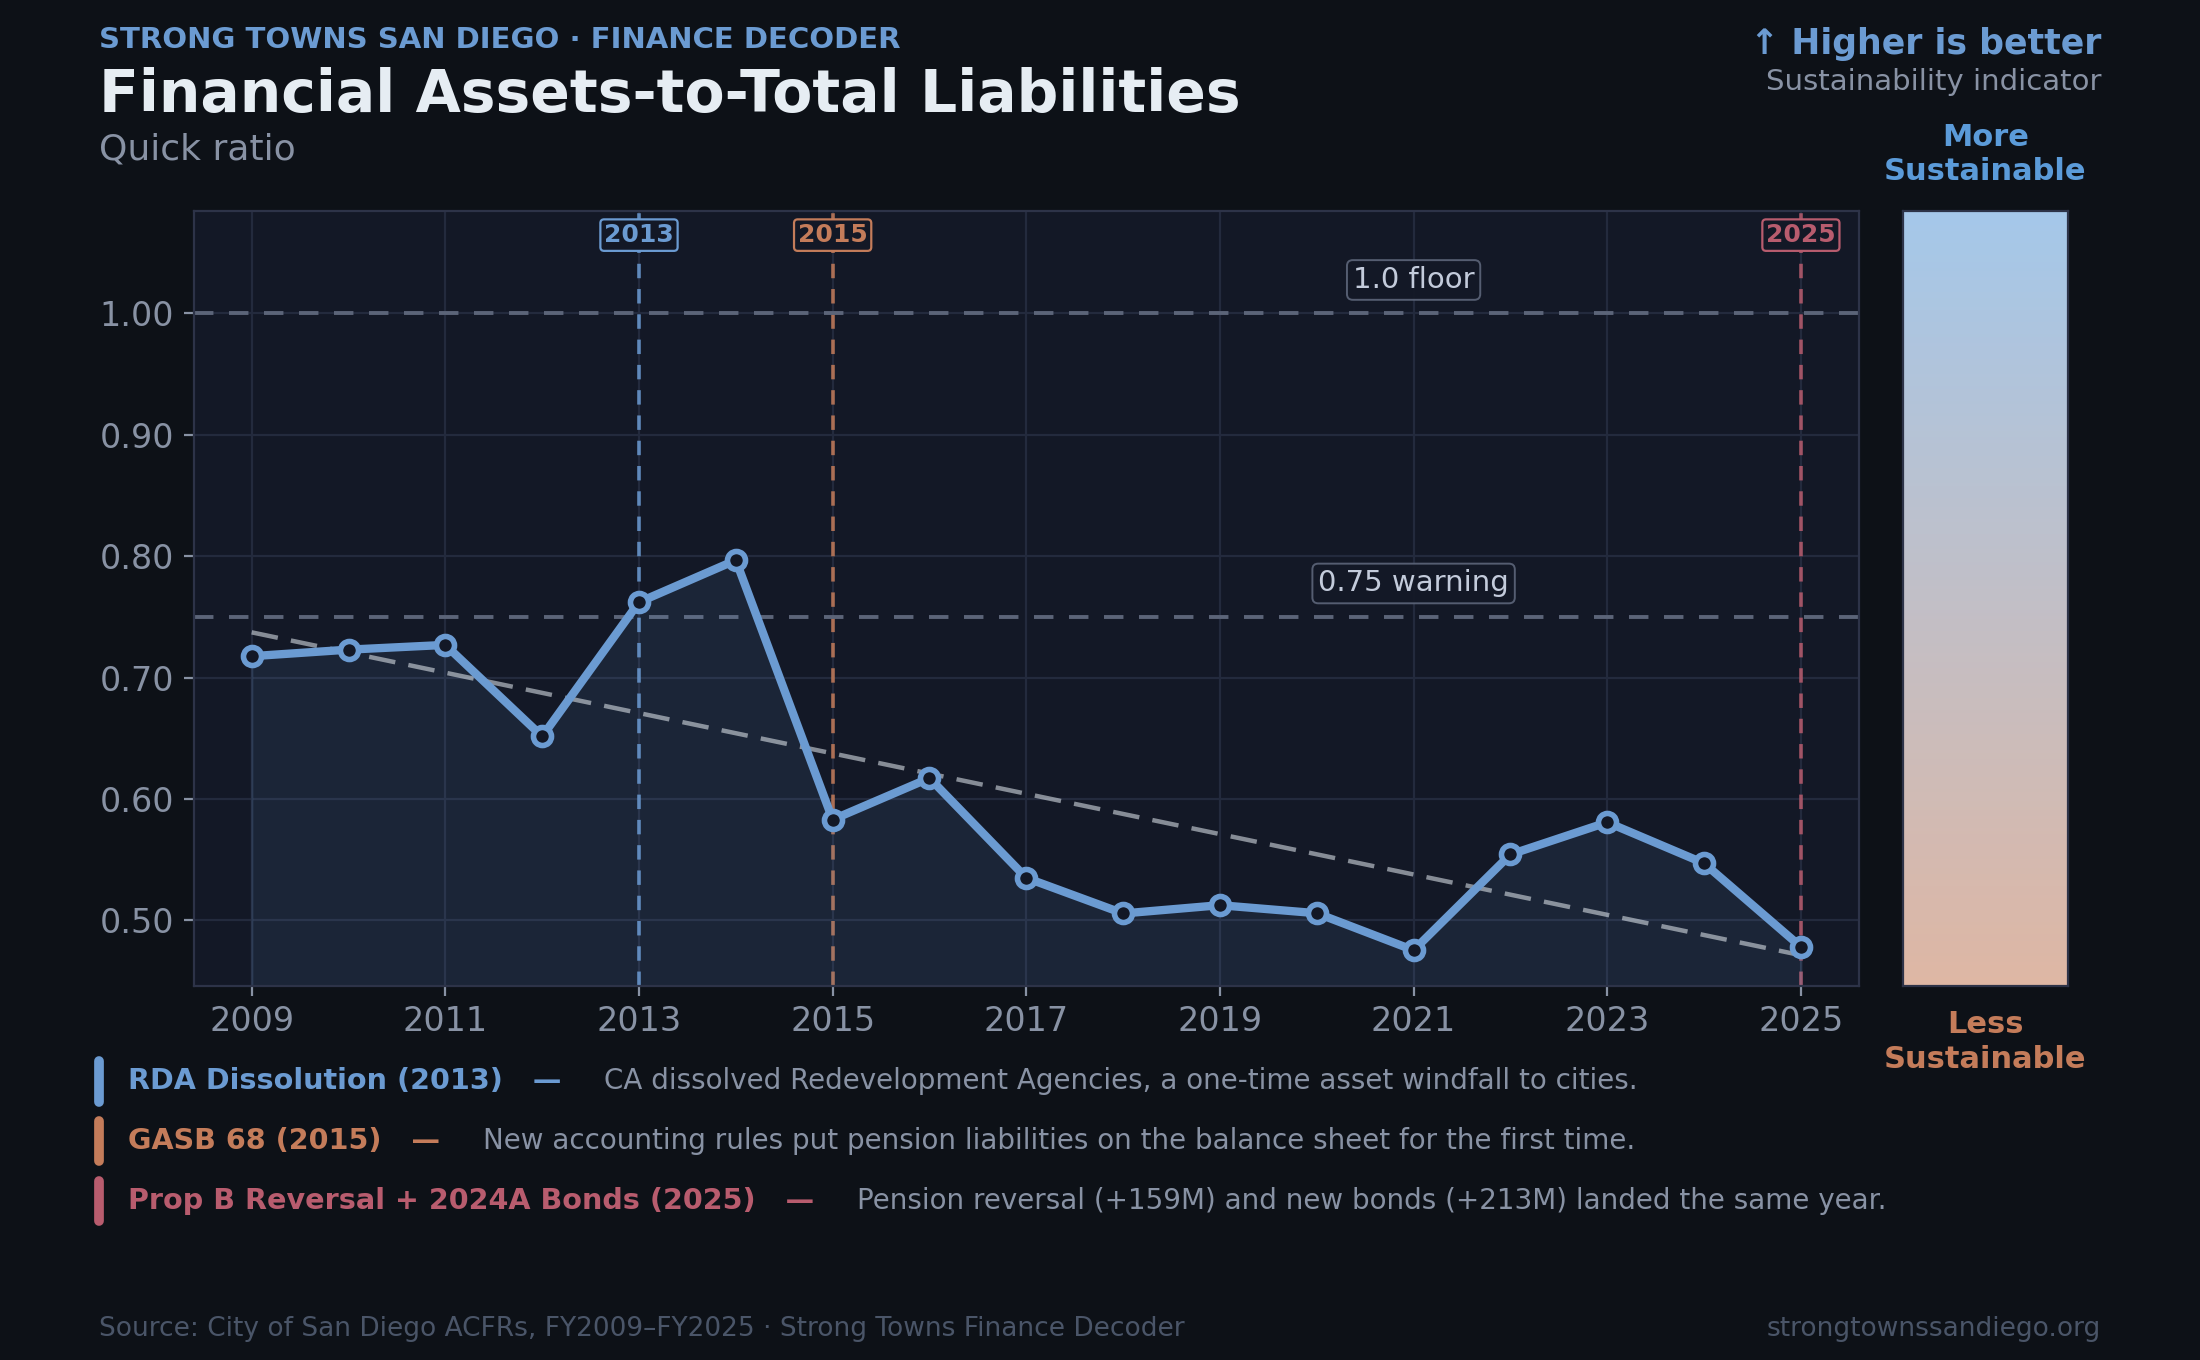
0.48 in FY2025. The second-lowest reading in the 17-year dataset.
A ratio below 1.0 means the city could not cover what it owes even if it spent every liquid dollar it holds. San Diego has been below 1.0 for the entire 17-year period. It has not once been in a position of immediate balance. The cliff visible between 2014 and 2016 reflects GASB 68, the accounting change that moved pension obligations onto the balance sheet. The ratio currently sits at 0.48. A reading below 0.75 is generally considered a warning sign for municipalities; at 0.48, San Diego is well below that.
What the city should do about this is the central question this article is building toward. The short answer: the ratio has two variables. Either obligations need to grow more slowly, or liquid assets need to grow faster. Growing liquid assets sustainably requires growing the revenue that generates them. That means making the city's land more productive, which is addressed in the final section.
Total Assets to Total Liabilities: The city owns more than it owes. But that gap is closing.
When you add capital assets (streets, pipes, buildings, equipment) to liquid assets, San Diego's total assets still exceed its total liabilities. The city is technically solvent. "Technically solvent" is, admittedly, the best kind of solvent only in the sense that it beats the alternative. What it tells us is that the city's long-term physical asset base is holding, even as its liquid position deteriorates. What it doesn't tell us is how much of that asset base is aging infrastructure that will cost money to replace.
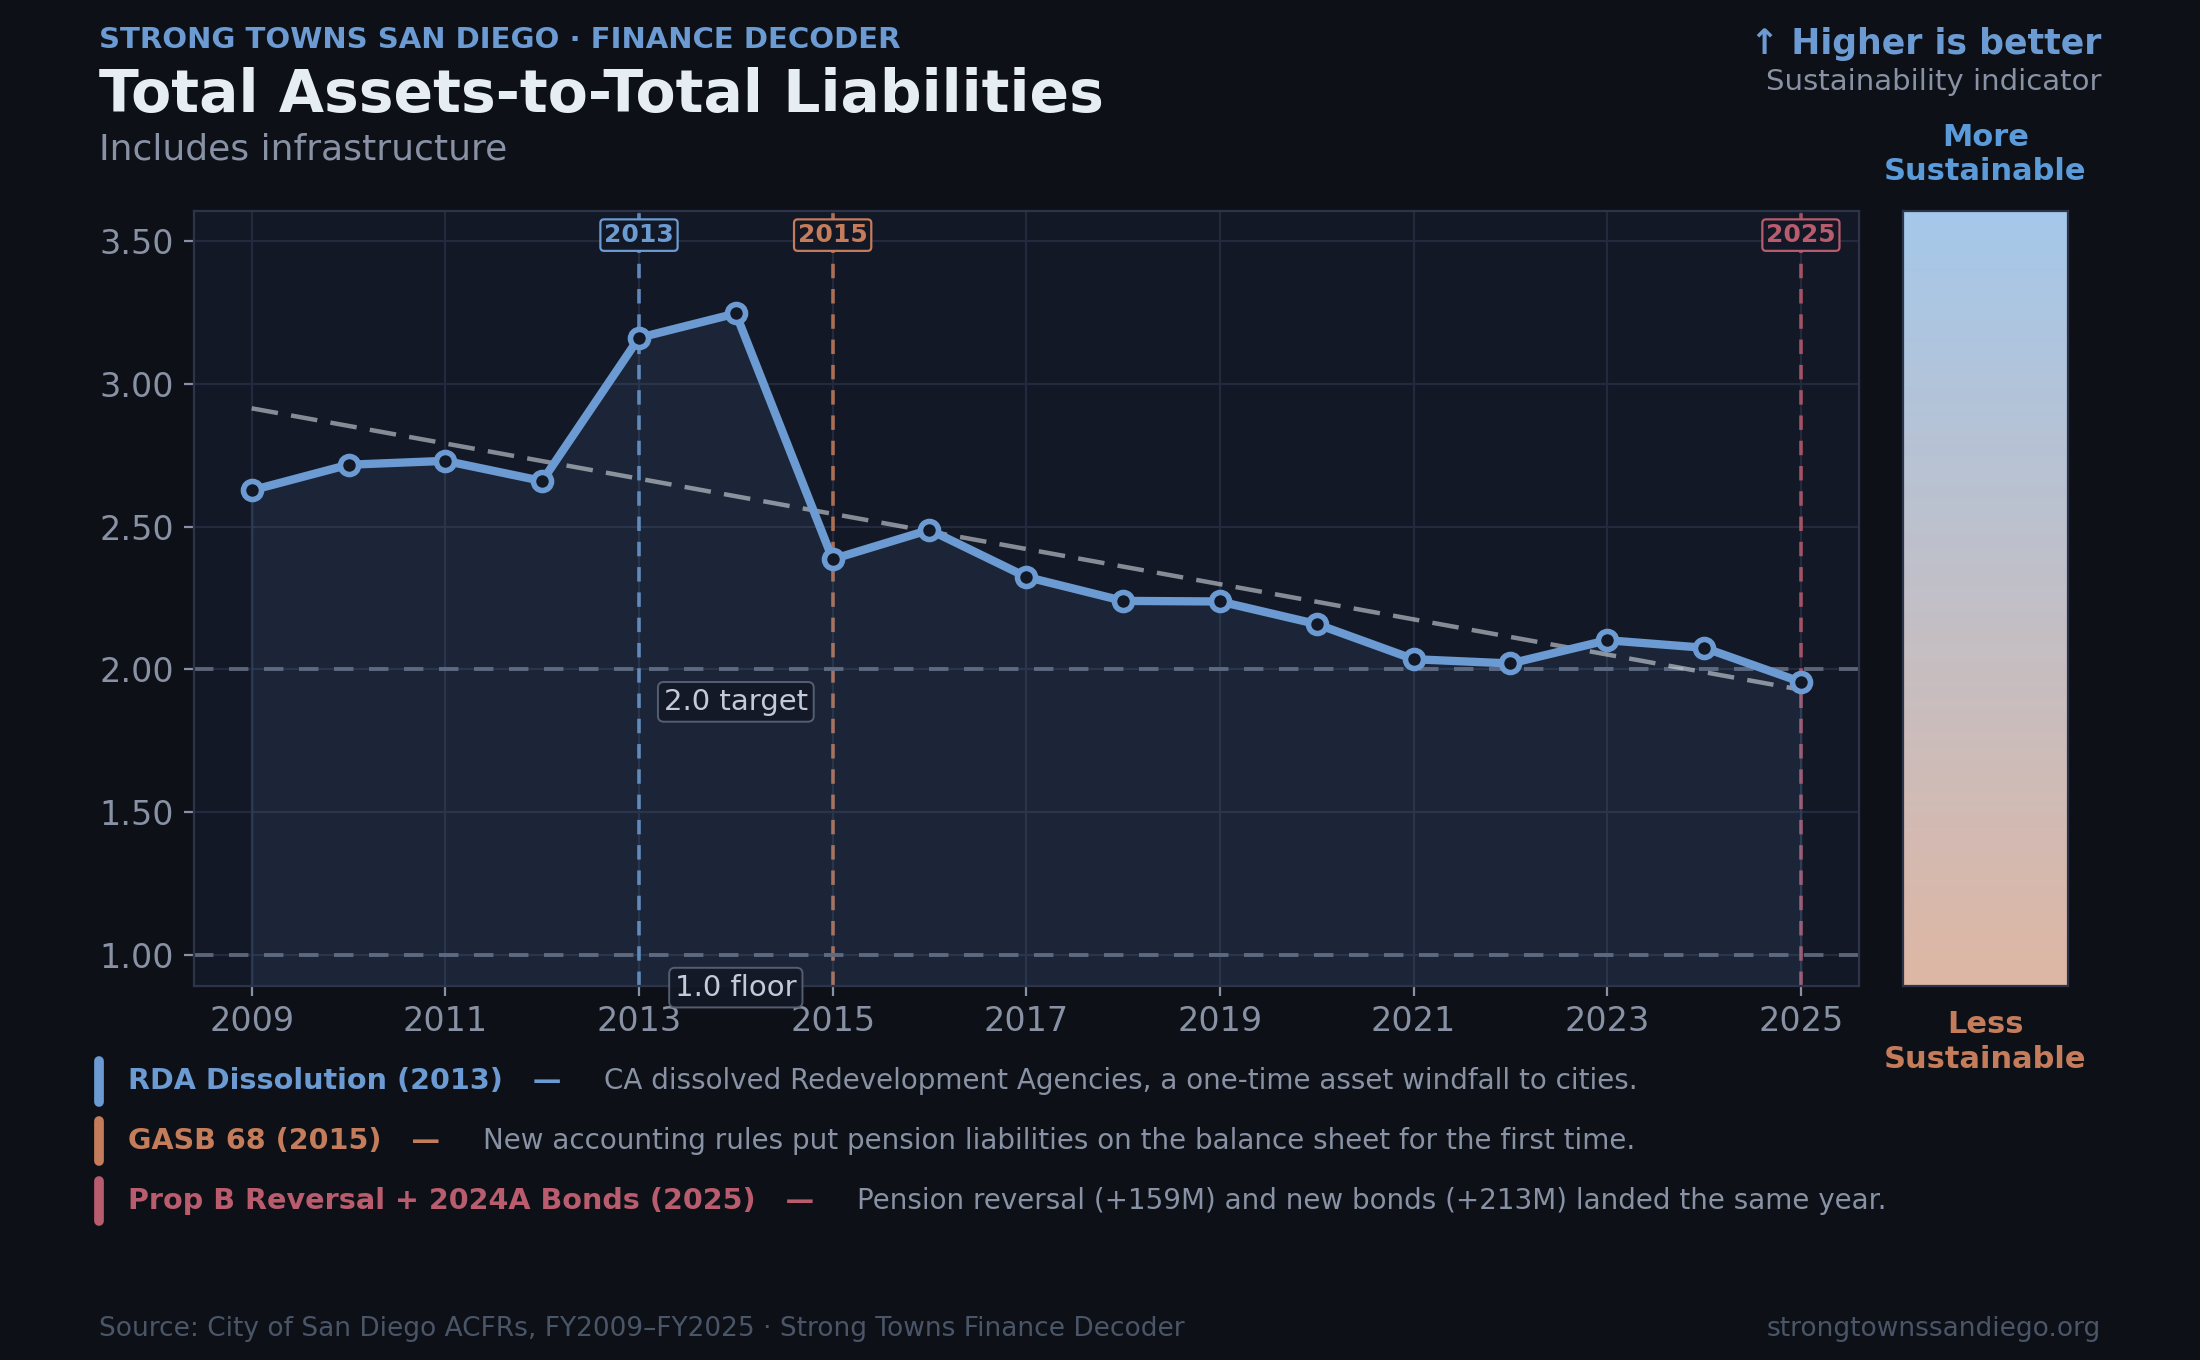
From 2.6x to 1.95x over 17 years, and still falling.
The ratio has compressed from 2.6x in 2014 to 1.95x in 2025. A ratio of 2.0 or above generally indicates that a municipality has reasonable asset coverage for its obligations; sustained readings below 2.0 suggest the asset base is becoming strained relative to what the city owes. San Diego crossed below 2.0 for the first time in this dataset in FY2025. That threshold is not abstract: it is one of the signals that has prompted the major budget cuts now underway. If city leadership had had access to the long-term trend data showing a decade of compression toward that threshold, they could have begun making gentle, strategic adjustments years ago rather than the painful emergency corrections being made now.
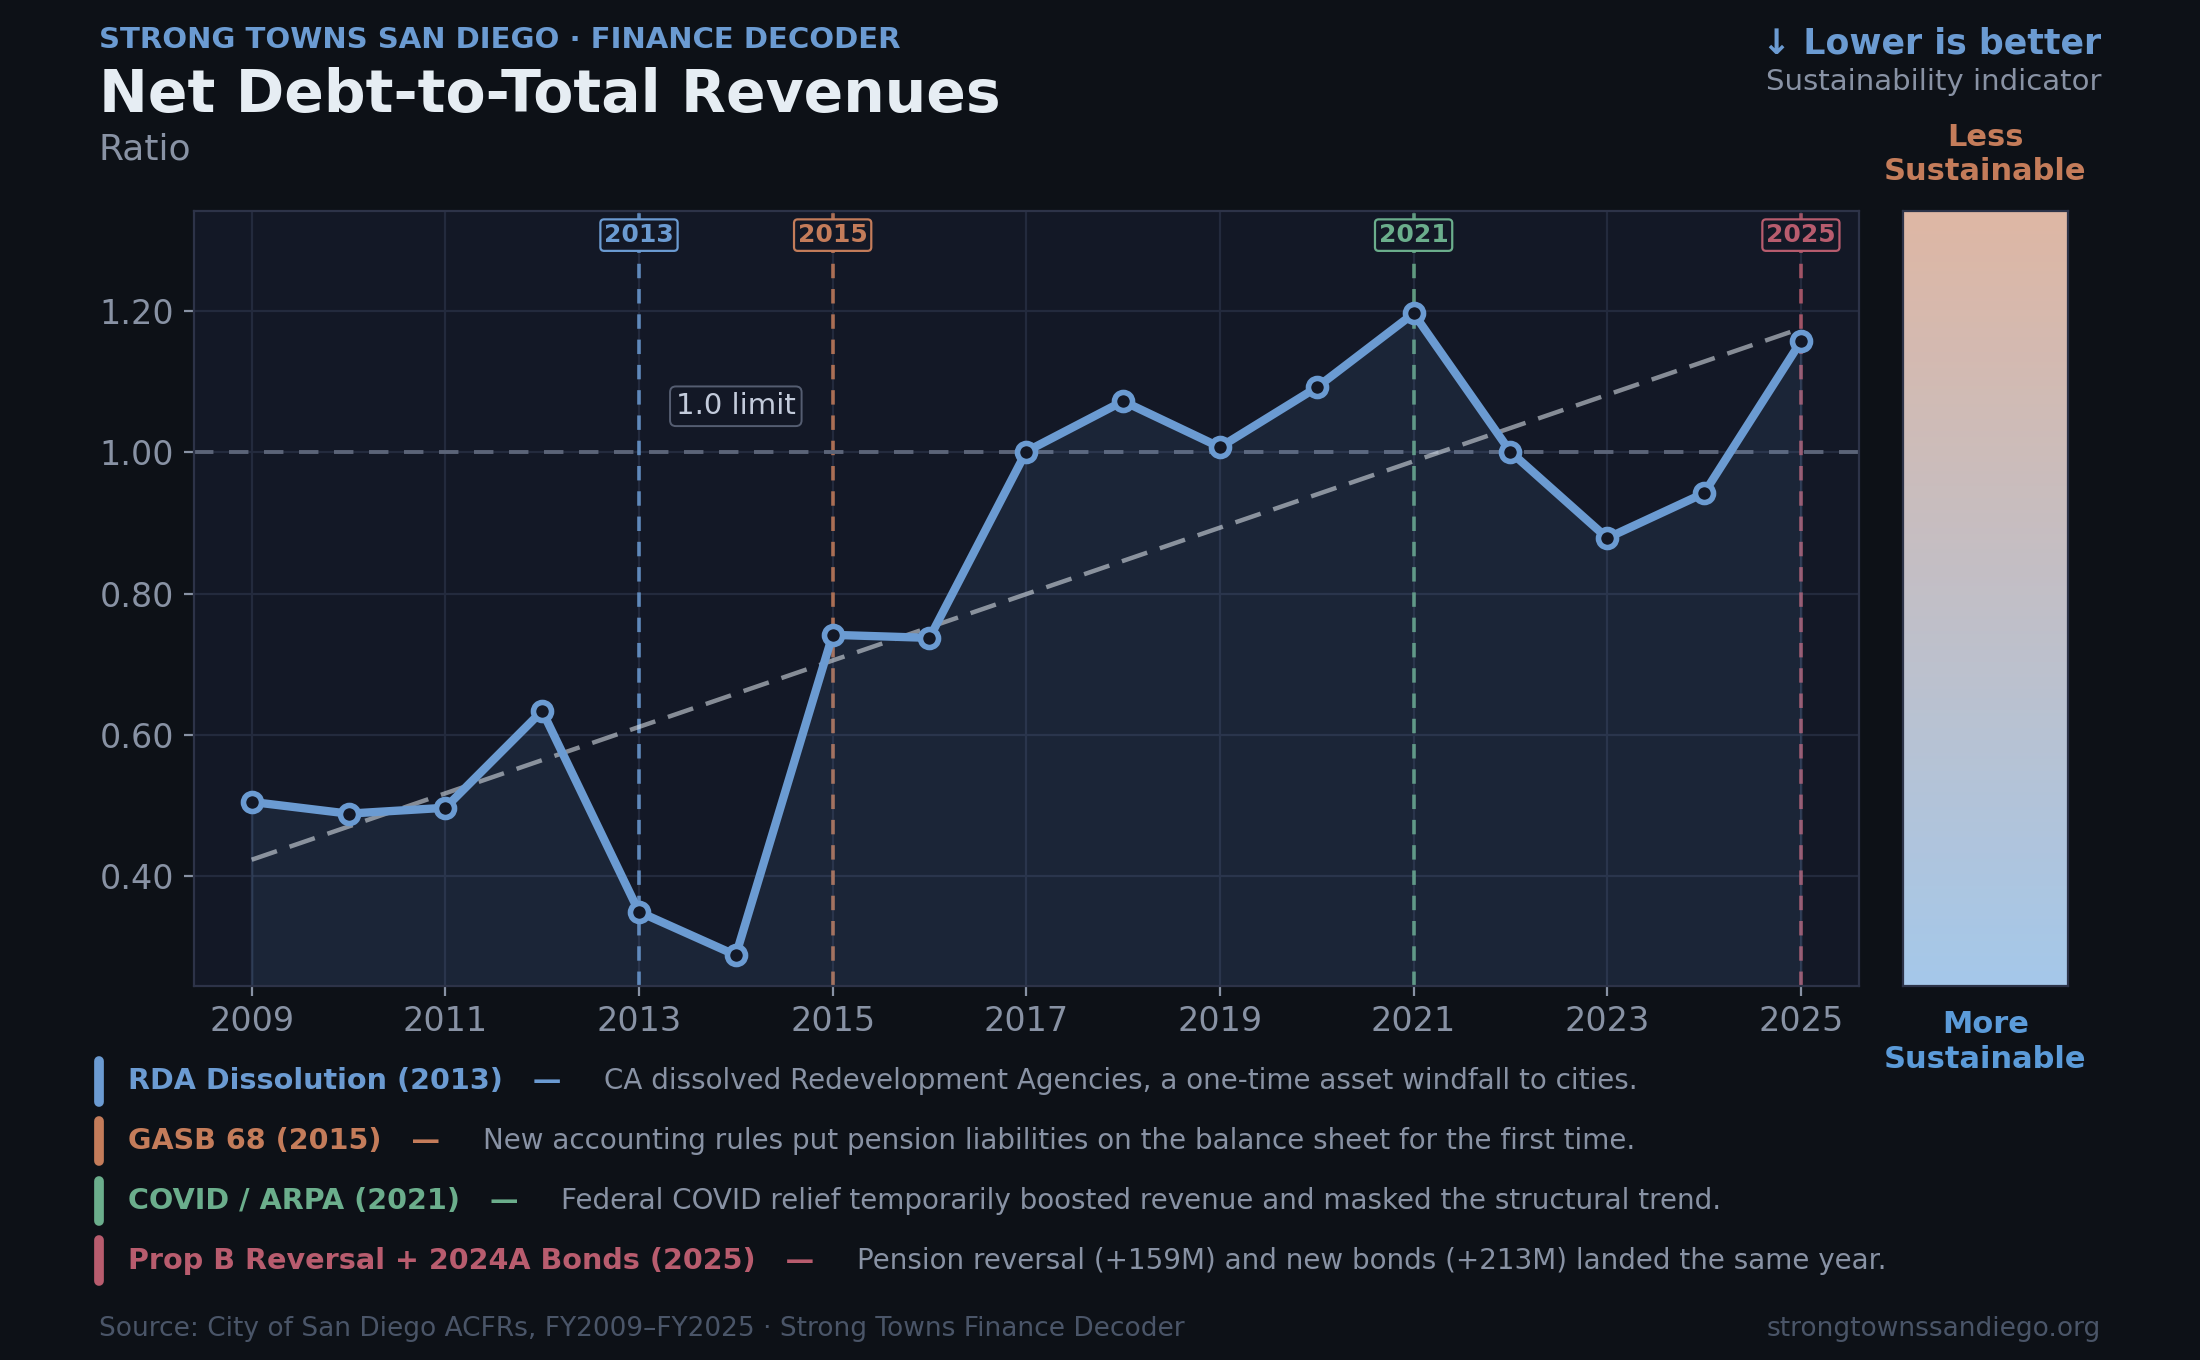
Net Debt to Total Revenues: San Diego crossed a line in 2016. It hasn't come back.
A useful reframe before interpreting this metric: going into debt is not inherently a sign of governing failure. Most homeowners carry a mortgage that puts their net debt-to-income ratio well above 1.0. The reason that's generally considered sensible is that a house appreciates in value, you keep the monthly payment below about 30% of your income, and you have a 30-year plan for getting to zero. Cities are not buying houses anymore. San Diego has been around for over a century and a half. The infrastructure it's financing is more like a car, or an appliance. Imagine if your annual car loan and appliance purchase debt exceeded your total annual income for eight consecutive years. That is what this chart is showing.
1.15x in FY2025. Obligations now exceed a full year of city revenue.
When this ratio exceeds 1.0, the city's net obligations (bond debt, unfunded pension liabilities, retiree healthcare obligations, and other long-term commitments, minus liquid assets) are larger than a full year of revenue. San Diego crossed that threshold around 2016-2017 and now sits at 1.15, the highest point in the dataset. A municipality can responsibly sustain debt above 1.0 if the debt is financing productive investment and there is a credible trajectory toward balance. What San Diego's chart shows is a ratio that has climbed for nearly a decade without a correction. Sustained above 1.0 without a plan, this trajectory leads toward functional insolvency: not a dramatic collapse, but a slow narrowing of options until essential services can no longer be funded.
The path forward involves both variables in the ratio: slower growth in obligations, and faster growth in revenue. The Strong Towns argument is that the most sustainable lever for growing revenue is not a new fee or a higher rate; it is making the city's existing land more productive, so that the same tax rates yield more from the same geography. That argument is developed in the final section.
Net Book Value to Cost of TCA: The city's infrastructure is aging, slowly but consistently.
Imagine two car owners. One changes the oil on schedule, replaces the timing belt at the recommended mileage, and addresses small problems before they become large ones. After ten years, the car is worth less than it was when new, but it runs reliably and the owner has avoided any catastrophic repairs. The second owner does the bare minimum: whatever the state requires for registration, nothing else. After ten years, the car is worth significantly less, but more importantly, the deferred maintenance has set up a transmission failure or an engine problem that will arrive without warning and cost far more than any of the skipped oil changes. The critical difference from the city's perspective: you can sell a car. You cannot sell a city's streets and pipes. When those fail from deferred maintenance, the city pays the repair bill indefinitely, year over year, in addition to all the other costs it's already carrying.
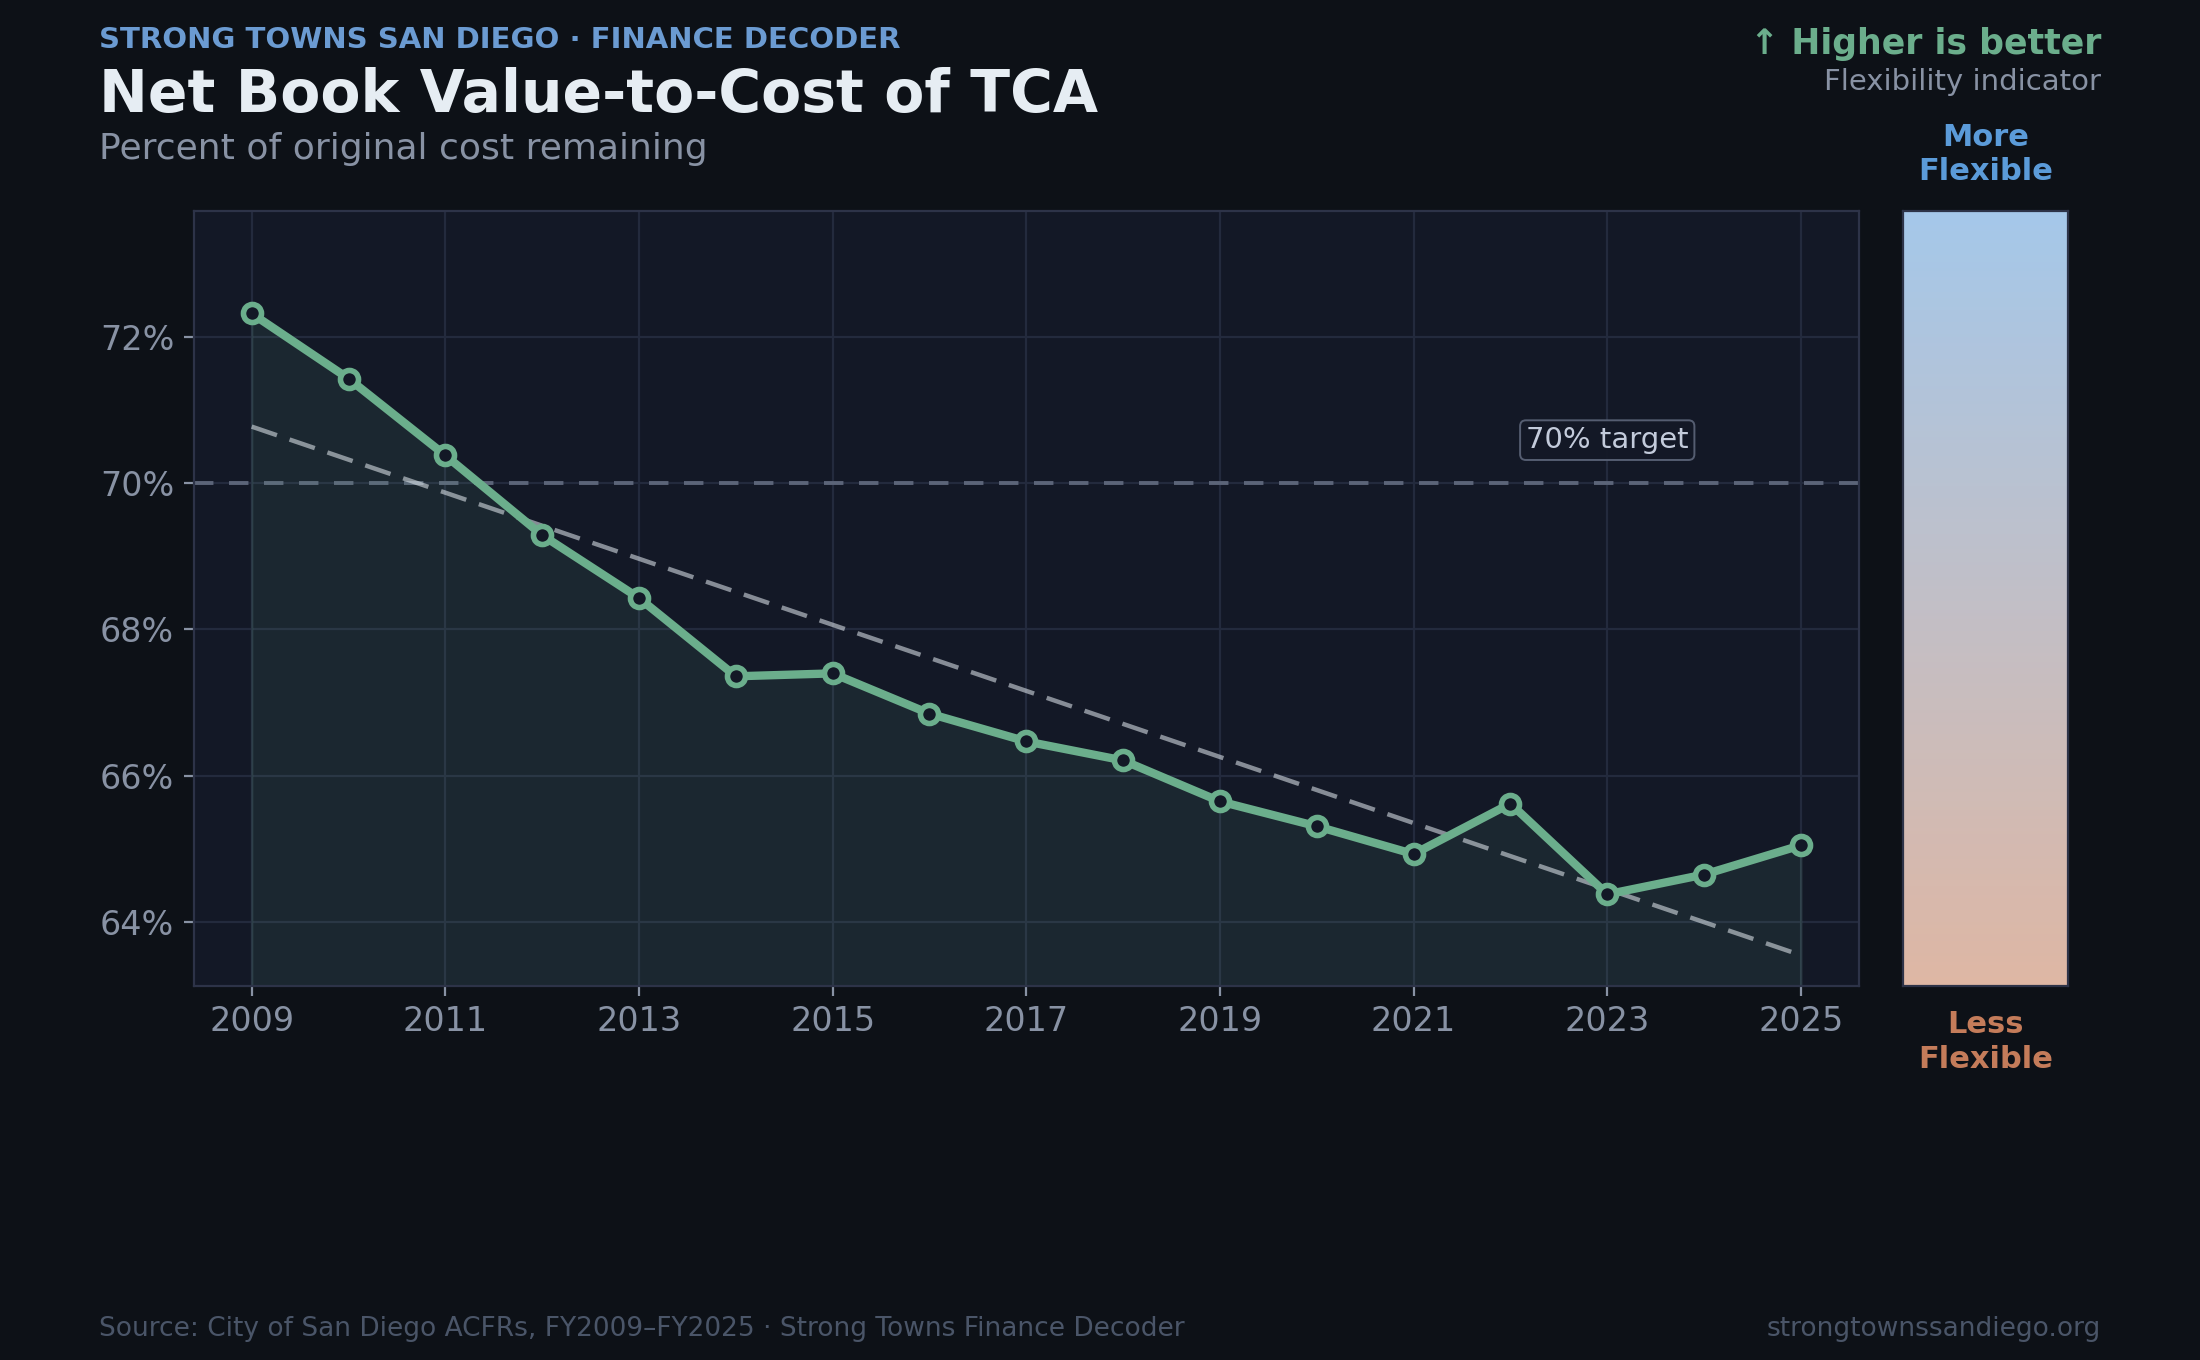
From 73% to 65% over 17 years. Pure Water is masking a steeper underlying drop.
This metric compares what the city's physical infrastructure is currently worth (after depreciation) to what it originally cost to build. A falling line means the city is not reinvesting fast enough to keep pace with the wear on what it already owns. San Diego has dropped from 73% in 2009 to 65% today. Most municipal finance frameworks suggest that sustained readings below 70% indicate that the deferred-maintenance bill is accumulating faster than it's being addressed. San Diego crossed below 70% around 2013 and has remained there since. The recent flattening is almost entirely explained by the Pure Water Program, with $2.2 billion in water and sewer construction currently in progress. When Phase 1 enters service and begins depreciating, this metric will resume its decline unless the city meaningfully increases broader reinvestment.
Interest to Total Revenues: The one chart pointing in the right direction, with a significant caveat.
Interest payments as a share of revenue fell from just over 3% in 2009 to under 1% today. This is a genuine accomplishment, and it is worth naming directly: the city's finance team deserves credit for the decisions that made it possible. Low interest rates during the 2010s created a refinancing window, and the city used it effectively. You can see the impact across the rest of the Finance Decoder: even as the balance sheet deteriorated, the cost of carrying that debt was kept well below inflation. That is a meaningful piece of fiscal discipline in an otherwise difficult picture.
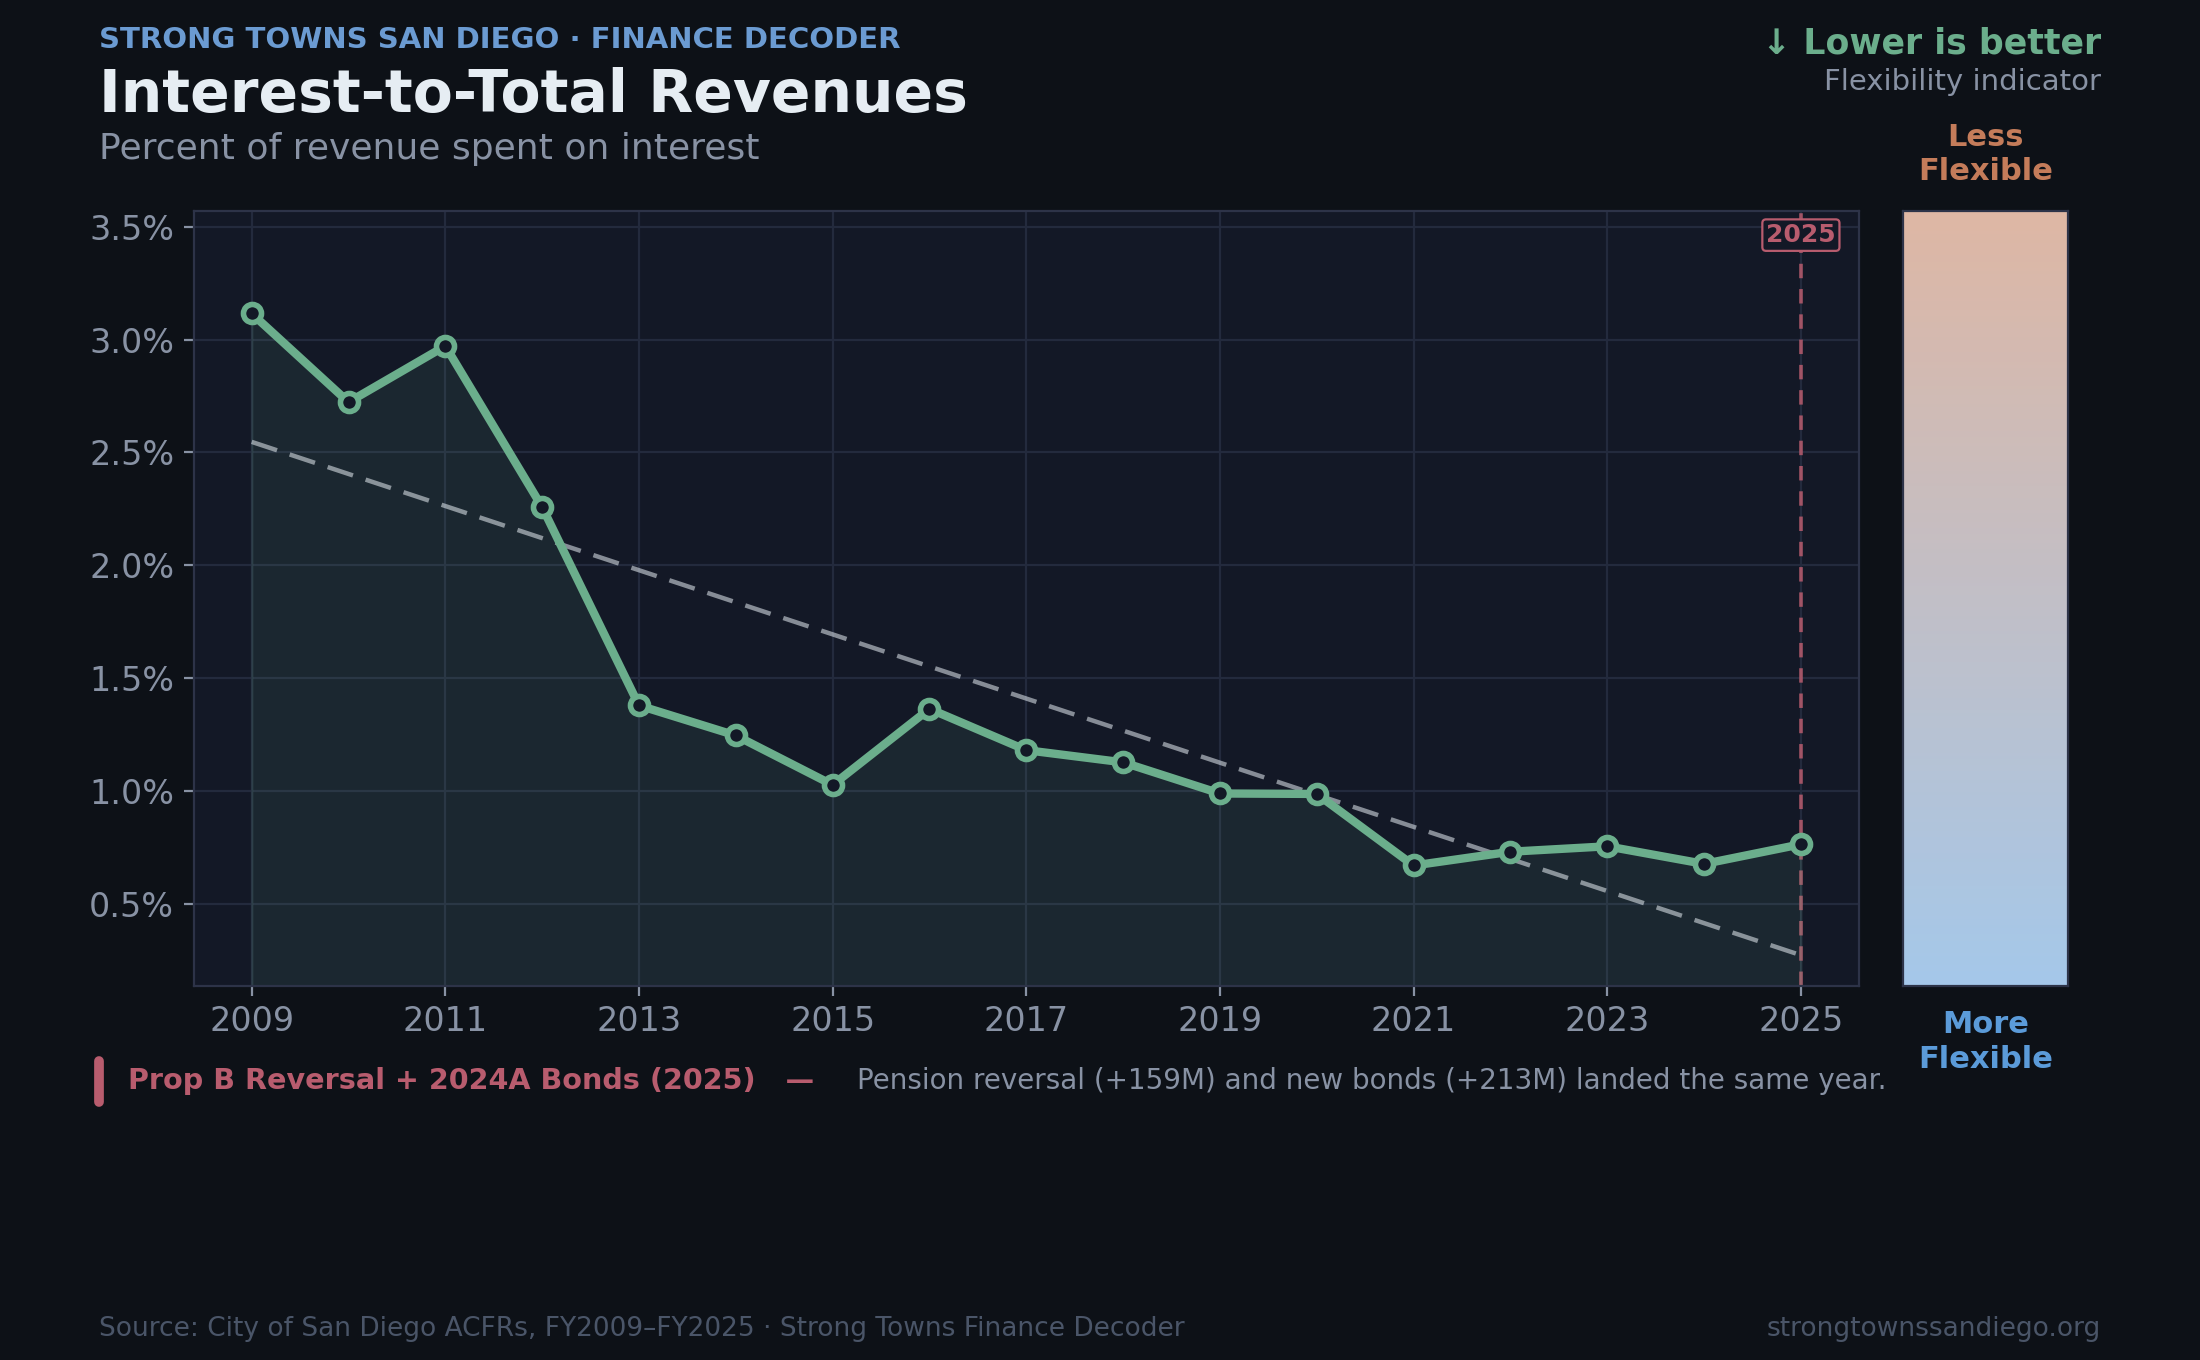
Under 1% today. New bonds issued in FY2024 are already moving it back up.
But the window is closing. The $213 million in new lease revenue bonds issued in July 2024 pushed interest costs higher. The Pure Water Program will add billions more in debt service over the next decade. And the post-pandemic interest rate environment has made refinancing at favorable terms significantly harder. If rates remain elevated and the city continues to take on debt, the one metric that has genuinely improved over 17 years is the one most likely to reverse.
This chart is also worth reading in the context of the city's revenue situation more broadly. San Diego has tried multiple sales tax ballot measures and various fee increases. These efforts haven't generated goodwill and haven't moved the needle structurally. Adding more interest expense on top of a revenue base that is not growing from its existing assets only narrows the options further.
Government Transfers to Total Revenue: Twice in ten years, San Diego leaned heavily on outside money.
The two spikes in this chart tell different stories but share a common problem. The 2015 peak reflects state revenues from the redevelopment agency wind-down. The 2021-2022 peak reflects the American Rescue Plan: hundreds of millions in federal COVID relief to San Diego, temporarily masking the underlying structural condition. At the 2022 peak, roughly 15% of the city's total revenue came from outside transfers.
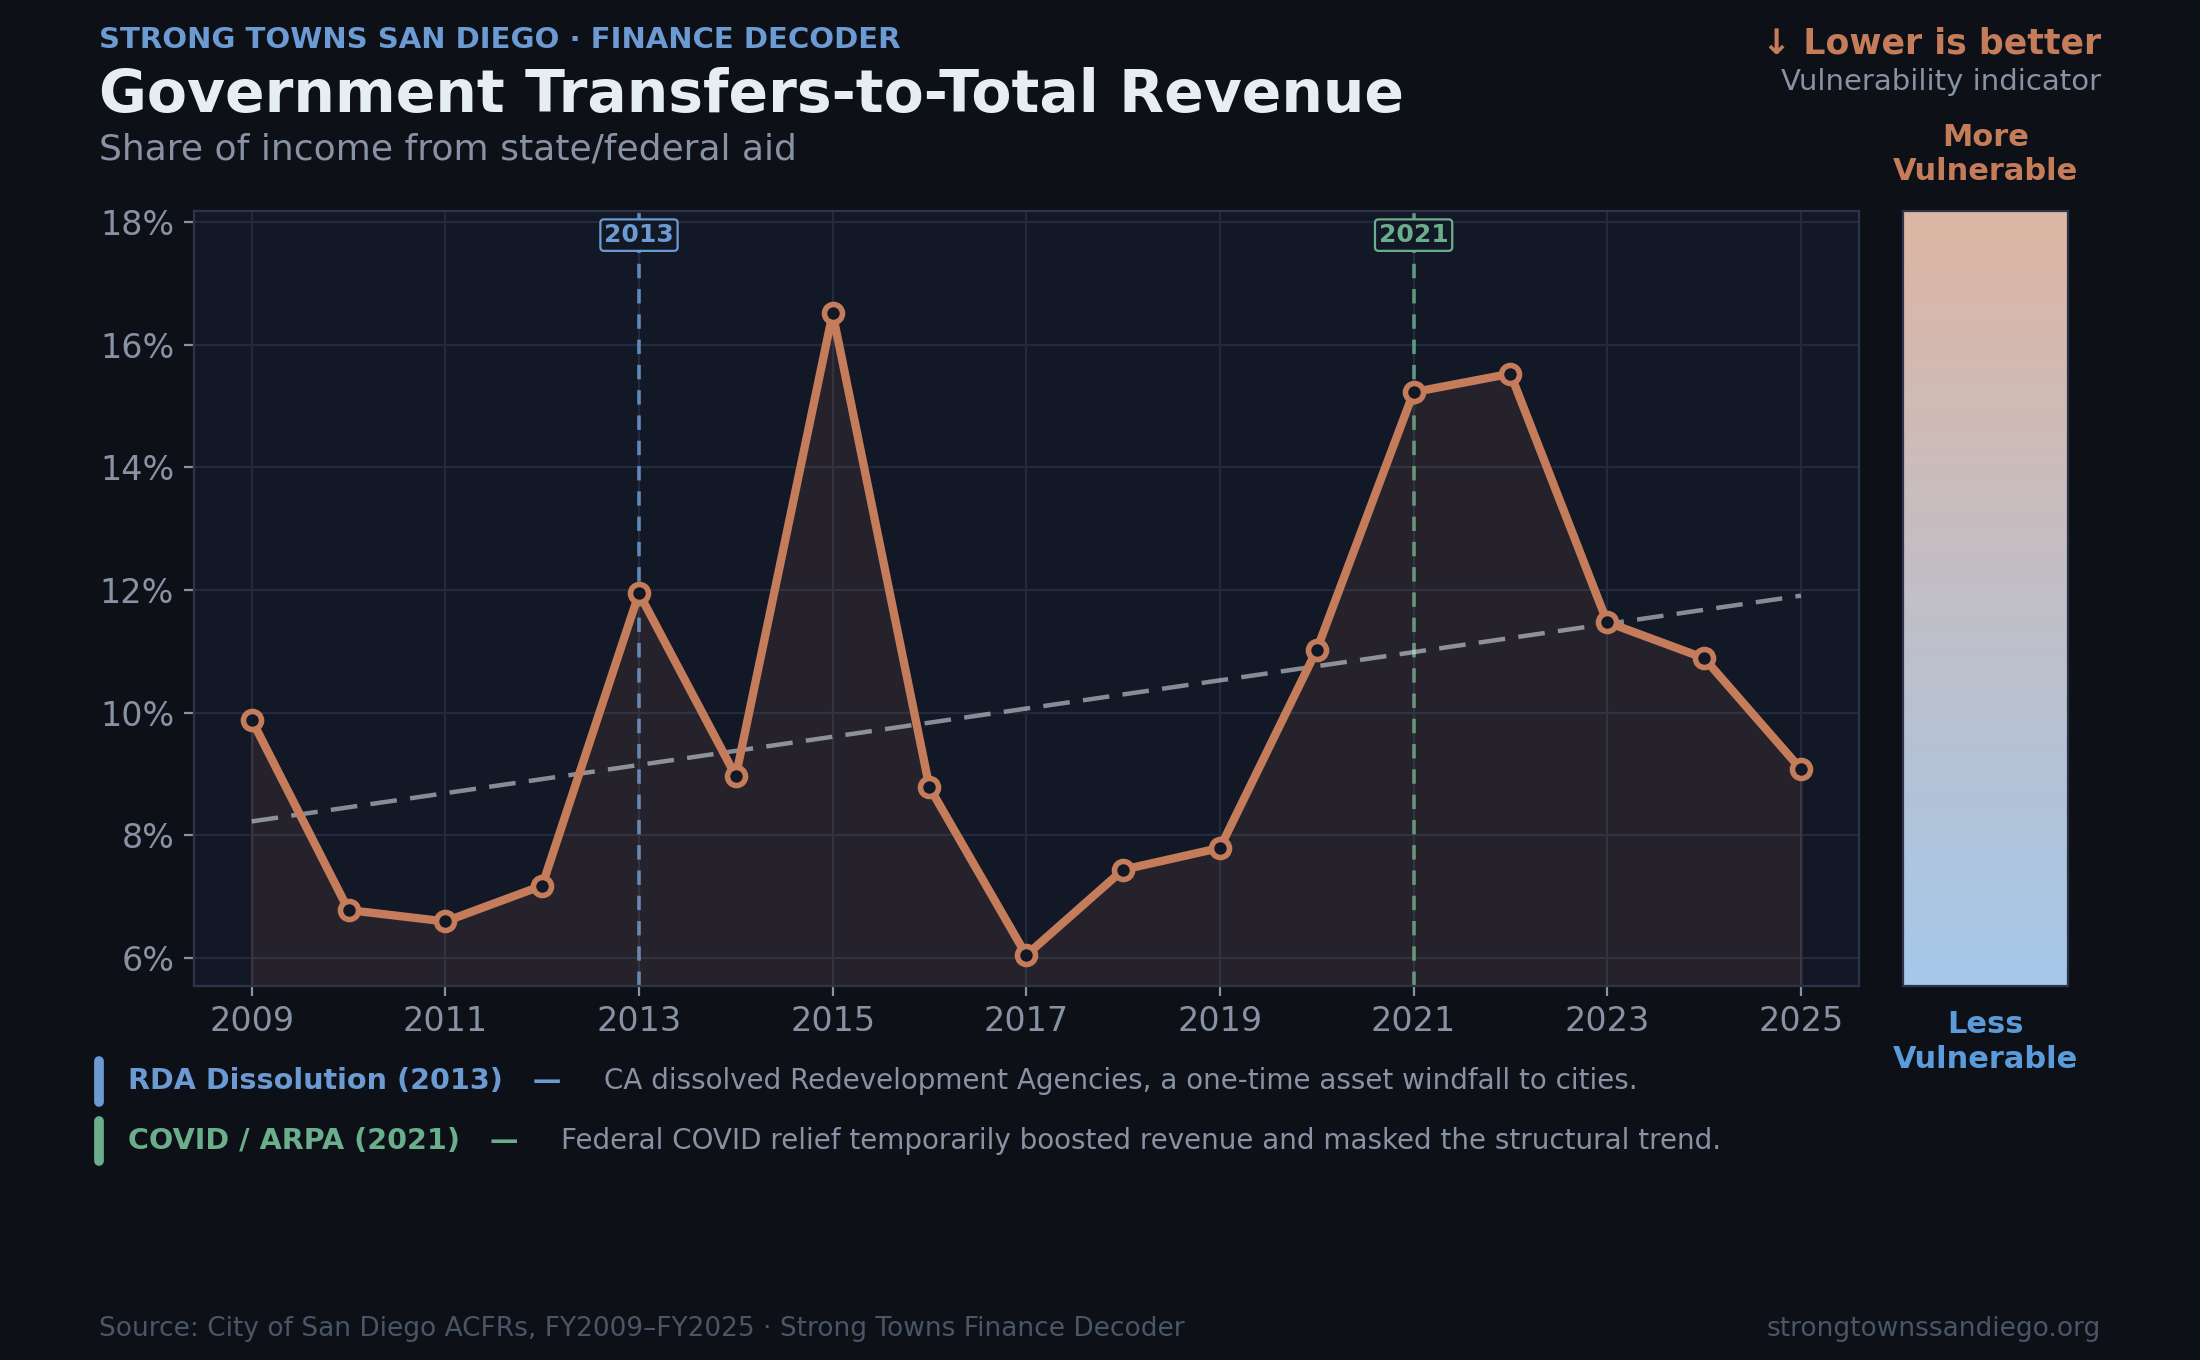
15% of revenue from outside transfers at the 2022 peak. Now normalizing, but from a higher floor.
What this chart is measuring, especially when mapped against the budget cuts that occurred during the down cycles, is that the city has been using state and federal transfers to cover baseline services and routine maintenance rather than to make capital improvements that would reduce long-term operating costs. This is a pattern with consequences that show up only after the transfers normalize.
A concrete regional example: Metropolitan Transit System used federal pandemic relief funds to subsidize fares and increase route frequency rather than investing in more efficient vehicles, updated signaling, transit priority infrastructure, or maintenance facilities. When that funding dried up, the agency faced what looked to riders like service cuts, but what it was actually facing was the end of a subsidy for a service level it could never have afforded on its own. The city made analogous choices: using state and federal grants to fund expanded library hours and arts programming, things residents value, rather than facility improvements that could have reduced long-term maintenance costs and allowed those same services to run more efficiently.
The principle that should govern grant strategy is simpler than it is commonly practiced: use local revenue to fund the baseline services and maintenance the city is permanently committed to, and use outside transfers to fund capital improvements that will become self-sustaining over time. Don't seek money just because it is available. State and federal representatives should be fighting to ensure the transfers San Diego receives are structured to fund the things that make the city stronger, not to paper over operational gaps that will reopen the moment the money stops.
Before you bring up the police
If your first instinct reading those charts is to think about public safety spending, that's reasonable. San Diego does spend a large share of its general fund on police, more than many comparable California cities. That is a real debate involving serious tradeoffs, and we plan to engage it in a dedicated piece. We're setting it aside here for one specific reason: it doesn't resolve the structural math that the Finance Decoder is measuring.
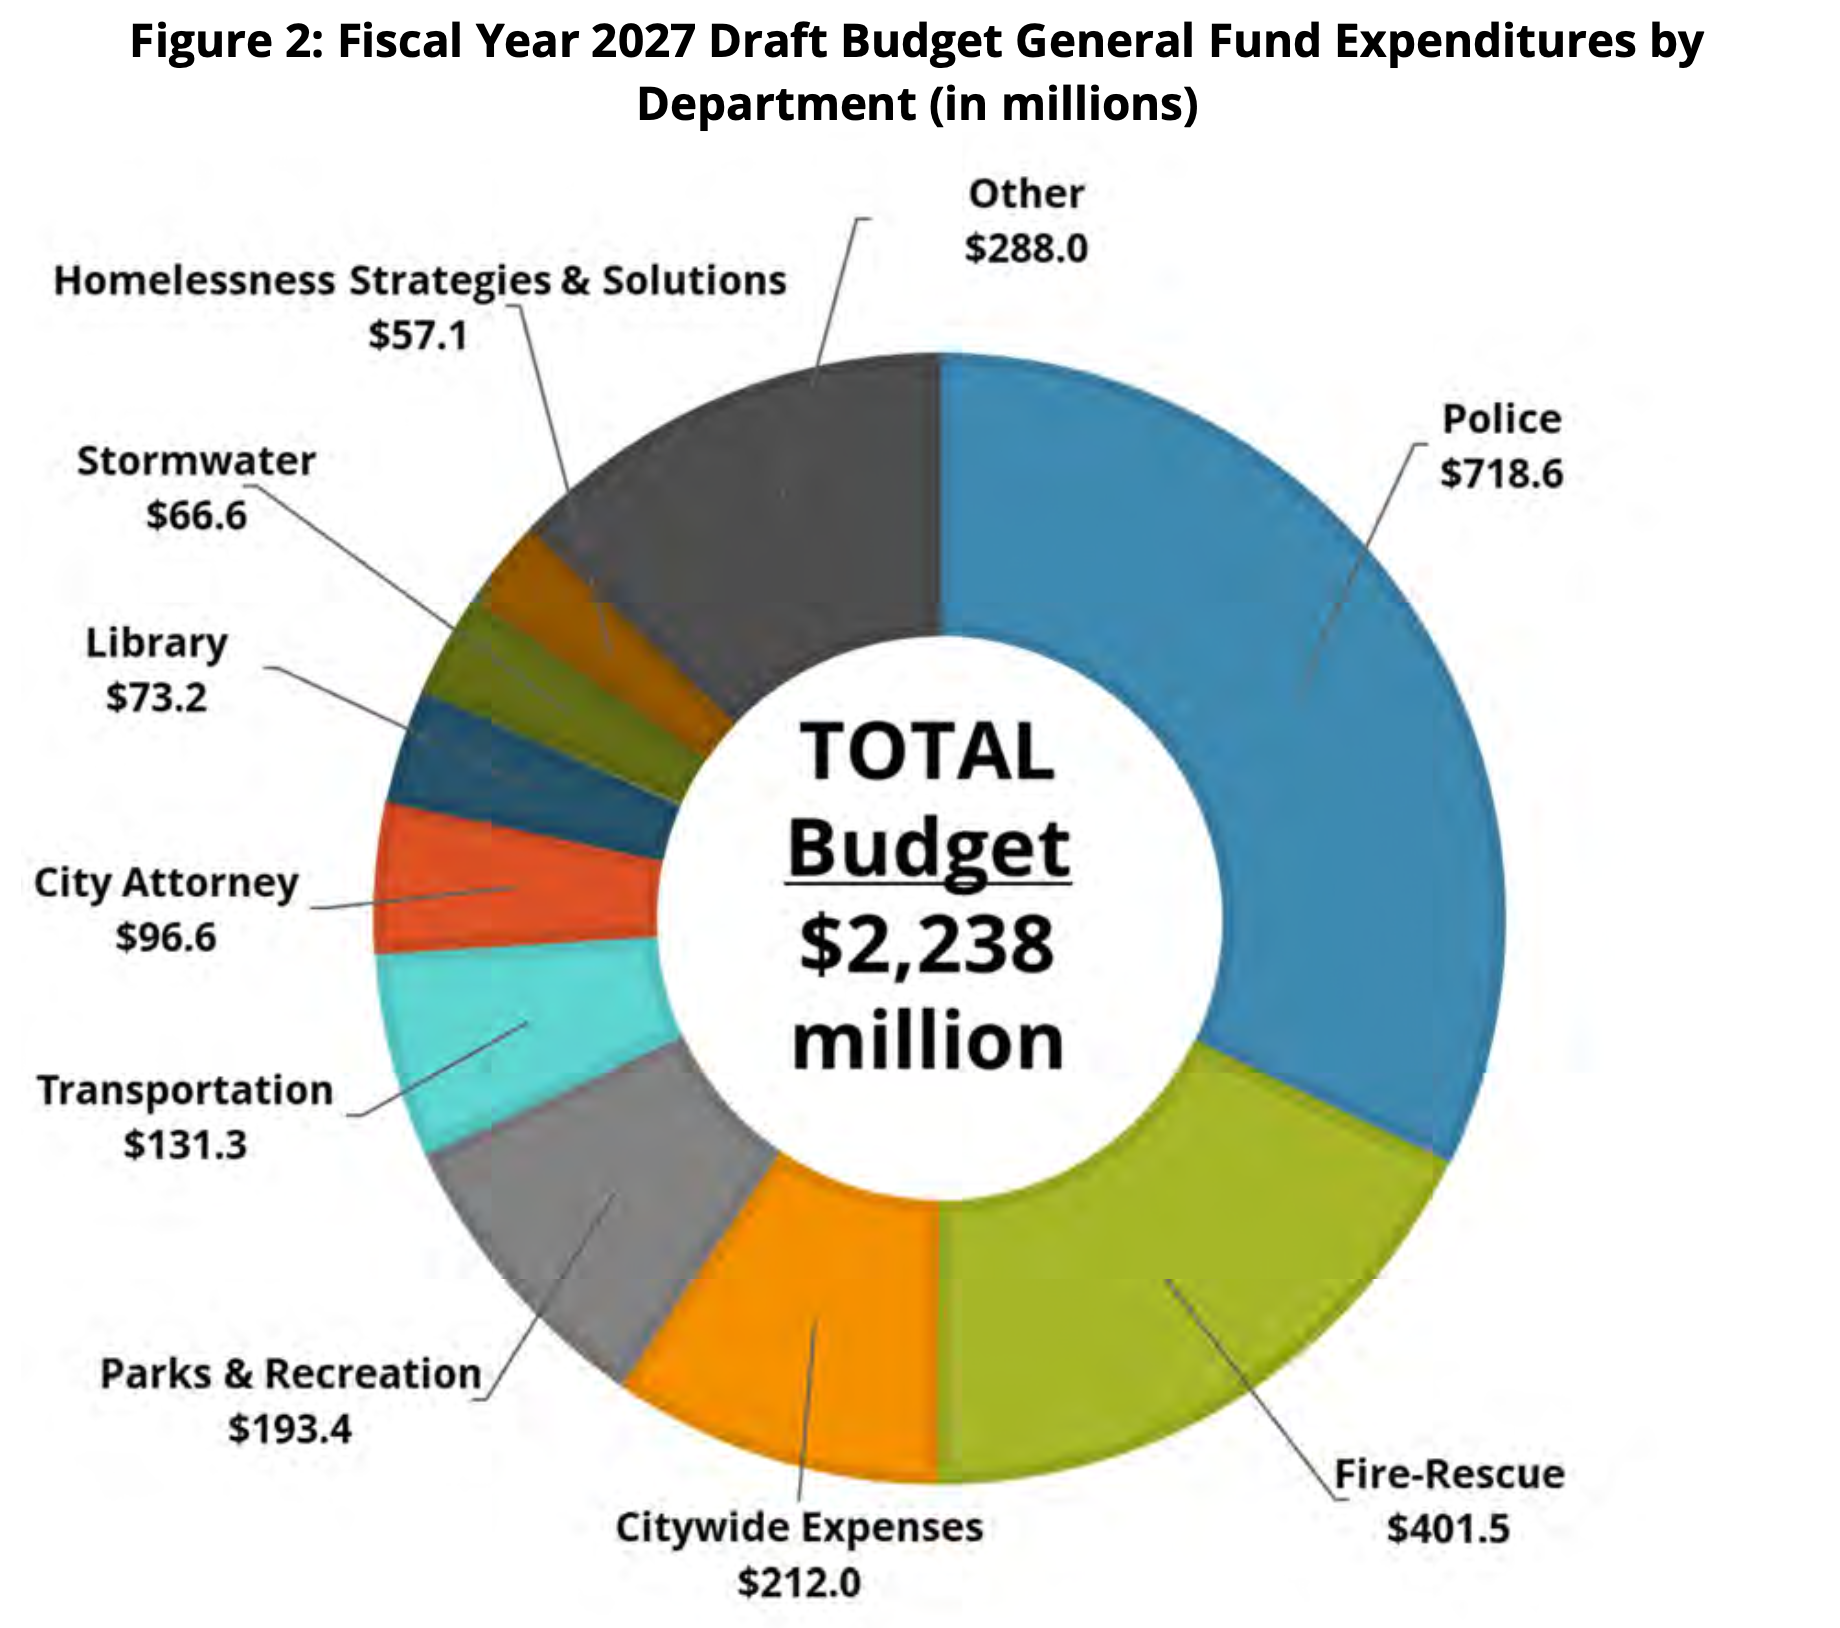
Source: City of San Diego Fiscal Year 2027 Draft Budget (pg. 93)
The city's infrastructure maintenance backlog runs into the billions of dollars. Closing that gap through police cuts alone would require reductions that are politically implausible and operationally disruptive, and would still leave the underlying fiscal trajectory intact. General fund spending decisions matter; we are not dismissing them. But the Finance Decoder is documenting a different and deeper problem. Conflating the two produces policy fights that feel important but don't address what the numbers are actually showing.
The same is true on the revenue side. San Diego's sales tax rate is lower than most major California cities. Property taxes are constrained by Proposition 13. California's effective property tax rate is among the lowest in the country. These are real constraints, and they deserve their own analysis. A higher sales tax or a reformed revenue structure would help at the margin. Neither changes the underlying structural condition this article is describing.
What the numbers are actually telling us
The Finance Decoder's most useful insight isn't any single chart. It's the combination. Together, they describe a city that has built and committed to maintaining more infrastructure than its current land base can sustainably finance.
San Diego recognized this constraint earlier than most cities. In the early 2000s, city officials acknowledged that less than 2% of the city's land remained available for new housing development. That acknowledgment was primarily framed around competitiveness: an unaffordable city loses the ability to attract workers and employers. But it was also an early recognition that the model the city had been operating under was running out of room.

[VALUE-PER-ACRE ANALYSIS — Map showing tax revenue generated per acre by land use type across San Diego ]
Source: https://geo.sandag.org/server/rest/services/Hosted/Parcels/FeatureServer
Property taxes, sales taxes, and service fees all flow from how land is used. San Diego applies its tax rates to a surface parking lot in North Park and to a six-story mixed-use building on the same block. The rates are the same. But the fiscal return per acre (the revenue a given parcel generates relative to the cost of the streets, pipes, parks, and services that reach it) varies enormously. A parking lot generates almost nothing per acre. A dense, walkable, mixed-use block generates substantially more from the same infrastructure.
The North American Pattern of Development that shaped San Diego after World War II assumed that growth at the outer edges would generate enough new revenue to cover the ongoing maintenance cost of everything built before it. San Diego expanded its infrastructure footprint on that assumption for decades. The city ran out of buildable land at the edges long before the maintenance obligations caught up. The gap the Finance Decoder has been measuring since 2009 is partly the consequence of that reckoning.
What these seventeen years of data show is not that any obvious mistake was made, or that any one budget line is obviously out of control, or that any particular administration caused this. They show a city whose existing infrastructure costs more to maintain each year than its existing land base generates in revenue under current land use patterns. That is a structural condition, not a political failure. The political question is what to do about it.
The case for productive land
Cities that have interrupted this kind of structural fiscal decline have not primarily cut or taxed their way to stability. They have gotten more value out of the land they already have, incrementally adding density and activity to places where infrastructure already exists and is underutilized.
San Diego's property tax rate doesn't change when a surface parking lot becomes a mixed-income apartment building. But the assessed value does. New construction resets at market value under Proposition 13, generating substantially more revenue from the same parcel under the same rules. And the increase in assessed value doesn't have to come at the expense of affordability per resident; when more units are added, the per-unit cost of infrastructure and services declines, even as the total tax revenue from the parcel increases.
Proposition 13 is often framed as a ceiling on what the city can collect. It is also a constraint on property owners who want to improve their properties. A homeowner who wants to add a bedroom or make a significant renovation may choose to skip the permit and the improvement entirely, because triggering a reassessment means a higher monthly tax bill in addition to the upfront cost. The result, in many cases, is unpermitted work with real fire, earthquake, and safety risks, and a missed opportunity for the city to capture the fiscal value of improvements that would otherwise benefit the neighborhood. Strong Towns San Diego advocates for reforms that address this barrier and others, while continuing to protect vulnerable residents from displacement. We will lay out those proposals in future articles.
Zoning decisions are making the Proposition 13 constraint worse than it needs to be. Many landowners across the city would welcome the opportunity to build something more productive on their parcels, and would accept a market-rate reassessment in exchange, because the value created by being allowed to build exceeds the added tax cost. New apartments, condos, and mixed-use buildings going up across San Diego are already demonstrating this: each one resets to market value and generates meaningfully more revenue per acre than what it replaced. Zoning rules determine how much of this can happen.
Strong Towns San Diego's position on this is worth stating precisely. We are not advocating for unlimited development flexibility. The goal is to allow enough flexibility to accommodate the city's actual rate of population growth and evolving needs, in ways that fit the context of each neighborhood. Change should be incremental enough that existing residents can make a reasoned, personal evaluation of whether a neighborhood's evolution serves them. What we are arguing against is the rigidity that prevents any change at all, that keeps an underproductive parking lot underproductive for decades while the city's balance sheet deteriorates around it.
San Diego doesn't have a spending problem, and it doesn't have a tax problem. It has a productivity problem. The seventeen years of data above show where that problem has been heading, and what kind of change would actually affect it.
Data source: City of San Diego Annual Comprehensive Financial Reports, FY2009-FY2025, analyzed using the Strong Towns Finance Decoder (strongtowns.org/decoder). Charts are interactive in the web version of this article.
Strong Towns San Diego advocates for fiscally resilient, incremental urbanism in San Diego. strongtownssandiego.org
Tags